
Run it locally
Bring up ClickHouse, the schema, PulsusDB, and an OpenTelemetry Collector with Docker Compose. Open the quickstart →
Run it locally
Bring up ClickHouse, the schema, PulsusDB, and an OpenTelemetry Collector with Docker Compose. Open the quickstart →
Deploy to Kubernetes
Install the Helm chart in single-process or split writer/reader mode. Read the Helm guide →
Send telemetry
Configure an OpenTelemetry Collector to send logs, metrics, traces, and profiles. Configure the collector →
Connect Grafana
Use the Prometheus API and optional compatibility endpoints with existing dashboards. Configure datasources →
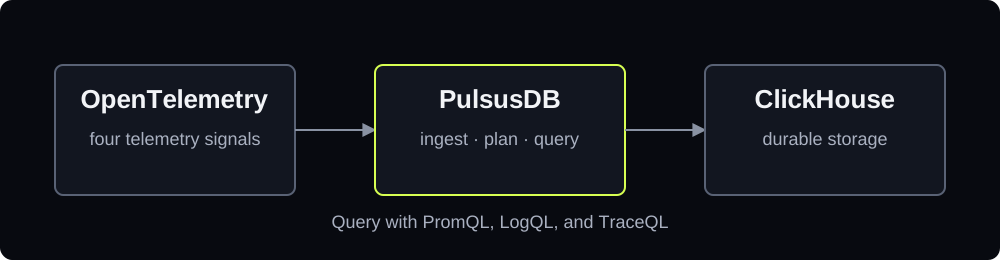
PulsusDB gives each signal its own ClickHouse schema, ordering strategy, indexes, and read path. Its stateless Rust processes can run together as one binary or split into independently scalable writer and reader tiers.
OpenTelemetry-native
OTLP is the primary ingest path. The Collector keeps instrumentation concerns outside the database.
Familiar query languages
Keep PromQL, LogQL, and TraceQL. PulsusDB parses and plans them against ClickHouse.
Read-path first
Purpose-built tables, skip indexes, shard-aware lookups, and exact rollup selection reduce unnecessary reads.
One binary, three modes
Start with all, then scale ingestion and queries separately with writer and reader modes.